Ditch the estimates and start forecasting
“NoEstimates cannot work because people want to plan ahead.” Sounds familiar? Actually NoEstimates means does not mean the absence of any forecasting and planning ahead. Quite the contrary. By tracking the throughput of a team and having a lean development process planning can actually become more reliable, despite not estimating a single story.
But how does this look in practice?
No Estimates but lots of forecasts
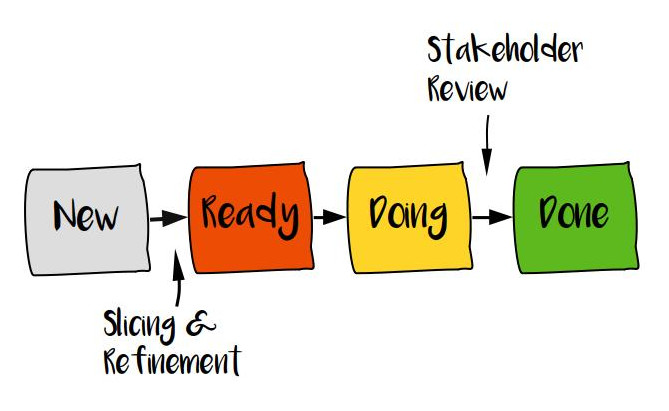
Instead of playing a broken guessing game for each user story in your backlog, using your past data and simply counting of stories for a forecast is much quicker and leads often to similar results. While estimation typically is only concerned with development effort, looking at cycle time for each story is a much better metric. In order to get the throughput and related cycle time time, having a defined (hopefully lean) value stream is a must. A typical value stream for a story often looks like this “New” -> “Ready” -> “Doing” -> “Done”. “Done” ideally meaning “Available to the customer” rather than “ready for internal QA”.
The main metric for planning ahead is story throughput. When trying to optimize the system later, cycle time (i.e. how long a story remains in each state) is a related metric to track. Throughput is very easily calculated by counting the number of stories delivered divided by the time this took:
throughput = number_of_stories / number_of_workdays
Adjusting for holidays and other planned absences might help if the capacity varies significantly over time.
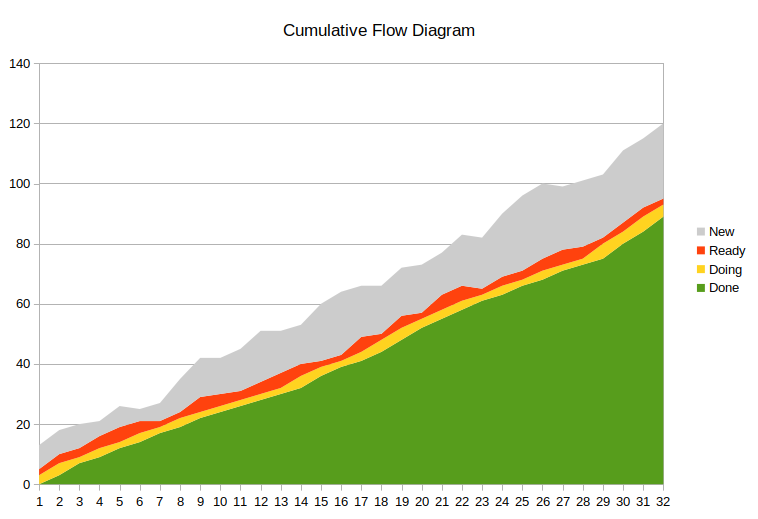
Having a lean development process means having just enough stories in “Ready” so the team never runs out of work. A good way of visualizing this is with a cumulative flow diagram. If the thickness of the “Ready” area roughly matches the thickness of the “Doing” or is slightly thicker then the team is running lean.
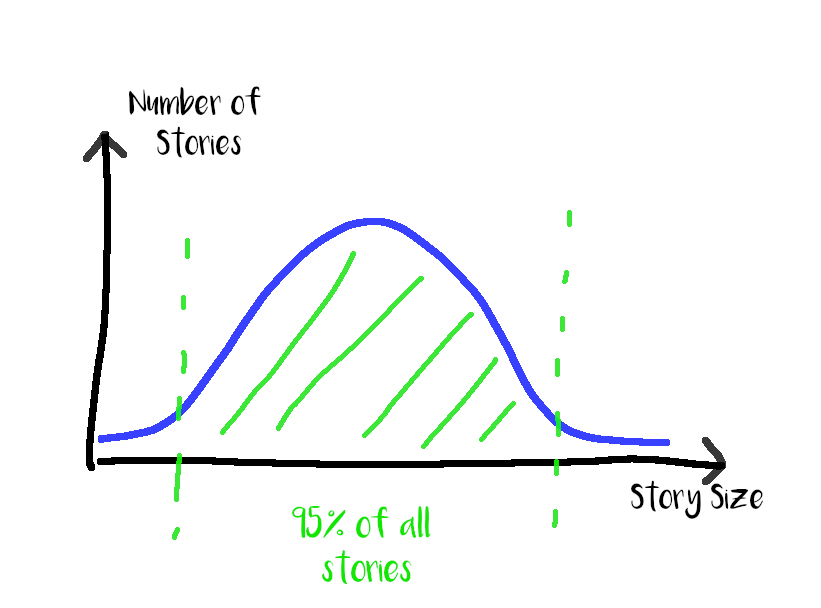
Since we can closely control the inflow of stories but are reactive when it comes to throughput in the “Doing” state this is where we measure. Increasing the frequency and number of refinement meetings is a straight forward way to speed up cycle time of the states “New” and “Ready” and to increase the amount of “Ready” items. Knowing the throughput and the variance of our development process enables prediction with great confidence. To determine the variance of our system measuring cycle time for stories is the way to go. Plotting cycle time into a graph usually results in a typical Gaussian bell curve. If the curve is flat and wide rather than steep and narrow the system is more volatile, predictions tend to be less accurate, but that is not necessarily bad, just something to keep in mind. If the variance in cycle time is very big investing more into slicing stories might help to increase the stability.
Forecasting
With the data for throughput and the cumulative flow diagram (CFD) as basis extrapolating a forecast becomes simple. Assuming a team just completed 6 iterations and managed to get 21 stories done, this gives an average throughput of 3.5 stories per iteration. By discarding the fastest iteration the throughput might fall to 3.1 and by discarding the slowest iteration the throughput might be 3.9 stories per iteration. (All numbers made up for this example) Given these numbers, drawing a line on the CFD produces a prediction on how many items we will completed at what point in the future. This might look something like this:
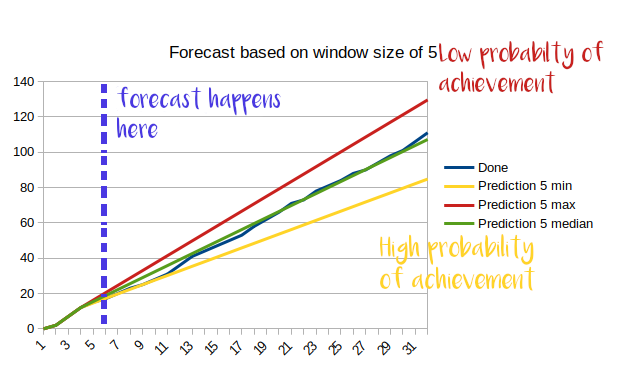
Applying this in regular intervals and increasing the sliding window size sharpens the forecast. The forecast is the story budget that the team including the PO has for an amount of time. Adjusting the straight line for upcoming bottlenecks of the capacity such as holidays, onboarding of new hires, trainings sharpens the forecast further. If doing kanban instead of iterations taking a reasonable time frame like 1-2 weeks for predictions works as well. The further we extrapolate data the more uncertainty we see, so readjusting the frequently to the current data and communicating this often with the stakeholders is a must.
Bringing it all together
By doing frequent, data-driven forecasting over the whole development process planning ahead is possible without giving out a single estimate for a story. The reliability of the plan might be even better than trying to estimate first because the whole development process is considered and not just implementation effort. That this allows to optimize the development process where it is actually hurting instead of trying “just to become better at estimating” is just one gain. By slicing the stories to a minimal, but valuable size the discussion shifts from “How much does it cost” to “how much do we gain” and increases focus on what is valuable rather than what is cheap.
Ditch the estimates, and start forecasting and deliver value!